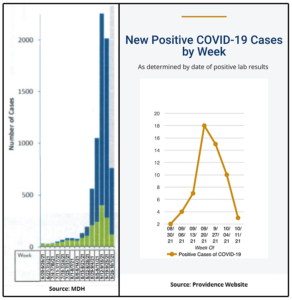
Community cases at PA dropped for the third consecutive week–precipitously in the past seven days.
The MDH published a graph the other day showing “Cases Associated with Pre-K through Grade 12 School Buildings” during the pandemic. The case trajectory at PA very closely mirrors the recent trend in Minnesota schools in general. (I include the MDH/PA graph comparison below; the MDH graph shows students in blue and faculty and staff in green, while the PA graph is composite.) The highest incidence of cases in schools during the pandemic came the middle of last month, as happened here, with drops recently. While these data in no way predict future experience, the recent downward trend is encouraging.
Click the chart above to enlarge it.
All PA students who have had COVID and completed their home stays are back in school. Reported symptoms have remained mild to moderate, with one significant exception. A student with a chronically compromised immune system made two hospital visits during the experience, with a diagnosis of “COVID pneumonia.” A difficult time for the child and family. We are so very happy that this student is also back in school today.
Once again, I’m posting updated versions of graphed MDH data on testing, cases, and ICU and non-ICU hospitalizations where COVID is a factor. Takeaways: testing and case numbers among school-age children are down and continue to correlate; hospitalizations with COVID as a factor remain very low, and continue not to correlate with testing and case numbers.
Click a chart below to enlarge it.


