I’m restarting a periodic reflection on PA’s experience with COVID that began last year. We think transparency is important. Our COVID Dashboard, helpful as it is, cannot adequately contextualize the data it conveys.
First, as to the Dashboard itself: it charts “active cases” among students at grade levels and among faculty and staff members, and then graphs the composite number of these over time. An “active case” is defined as a lab-confirmed diagnosis of a member of our school community who (1) was present in school or a school activity while infectious, and/or (2) possibly contracted COVID-19 as a close contact while in school or a school activity, and (3) is currently isolating at home. There will be instances that you may hear about where a community member contracts COVID, but about whom neither (1) nor (2) apply (e.g. they contracted it while quarantining at home, during summer or a school break, etc.). We do not chart these as “community cases” because they are irrelevant to any possible infectious situation at school or school activities.
Our accounting of active cases does not speak to symptoms (or absence of them) among those who test positive. We will be in touch with families of community cases, to learn of the experience with COVID symptoms, their absence, mildness, or severity.
The relative frequency of severe symptoms seems to us more a compelling data consideration than mere numbers of cases. Providence has 20 years of experience with illnesses whose case numbers can tend to rise in autumn. It would be unsurprising if PA experiences this with COVID (as is being seen outside our walls), and “normal sicknesses” such as the common cold, strep, and RSV. As I say, it is the degree and frequency of COVID severity that we will be especially attuned to. Again, we will be collecting this information through discussions with families. I’ll have opportunities to comment in this space on what we learn.
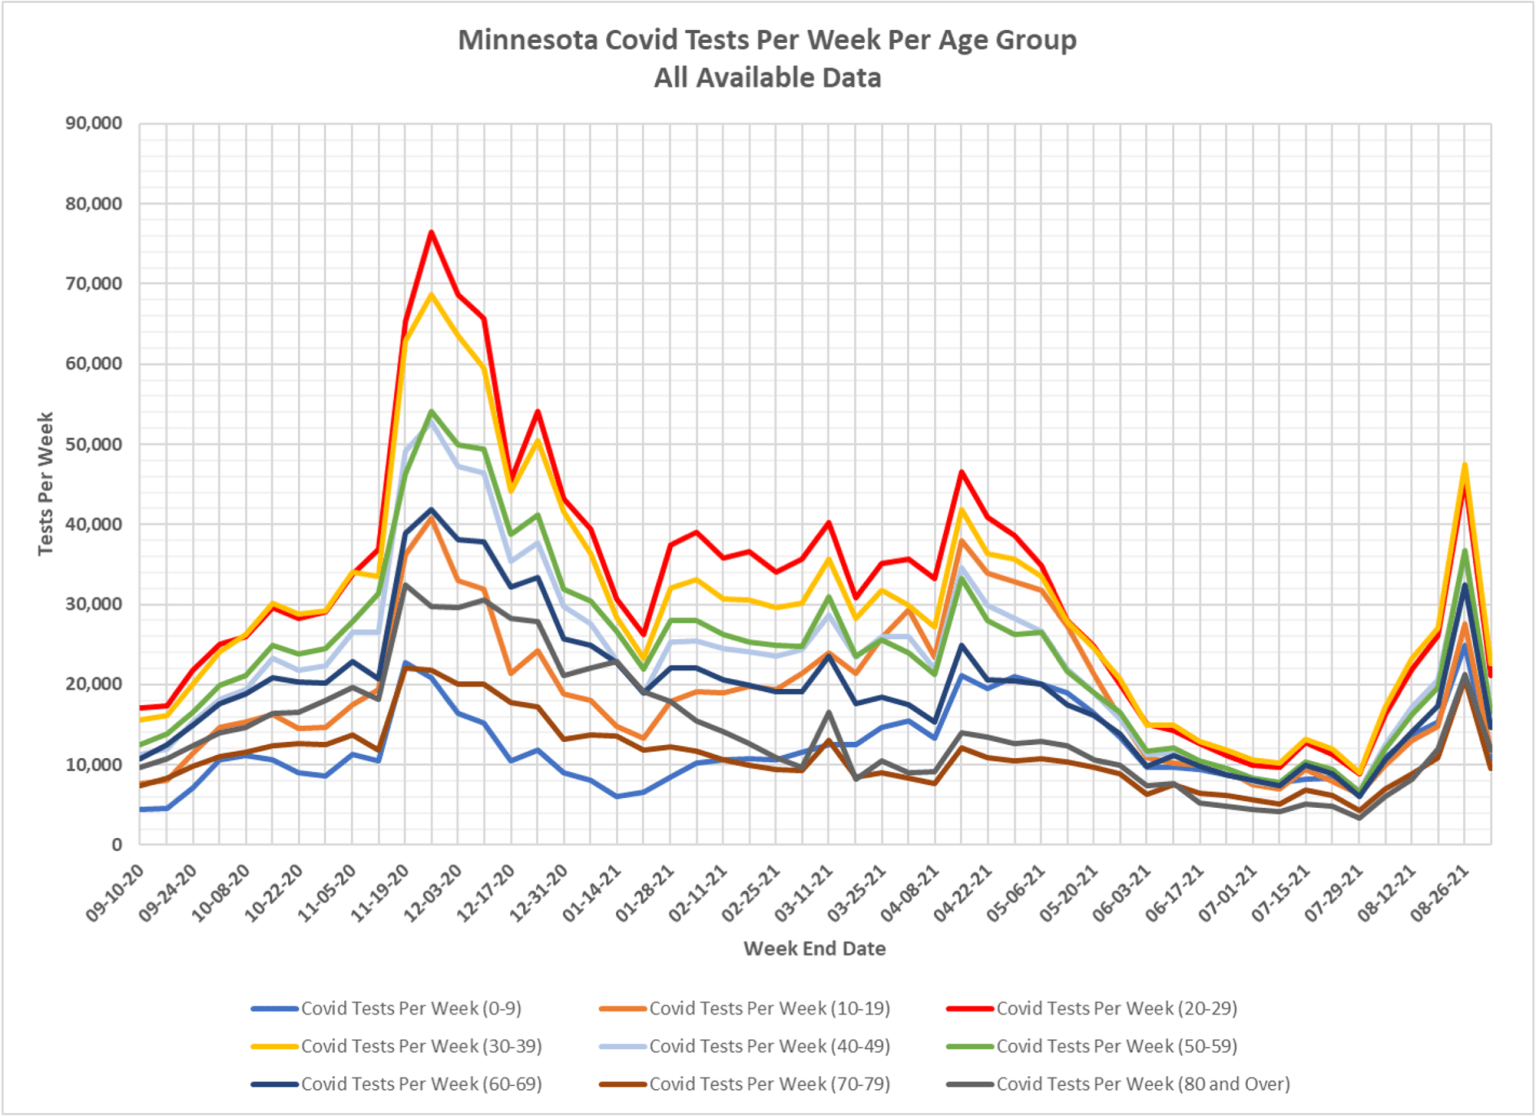
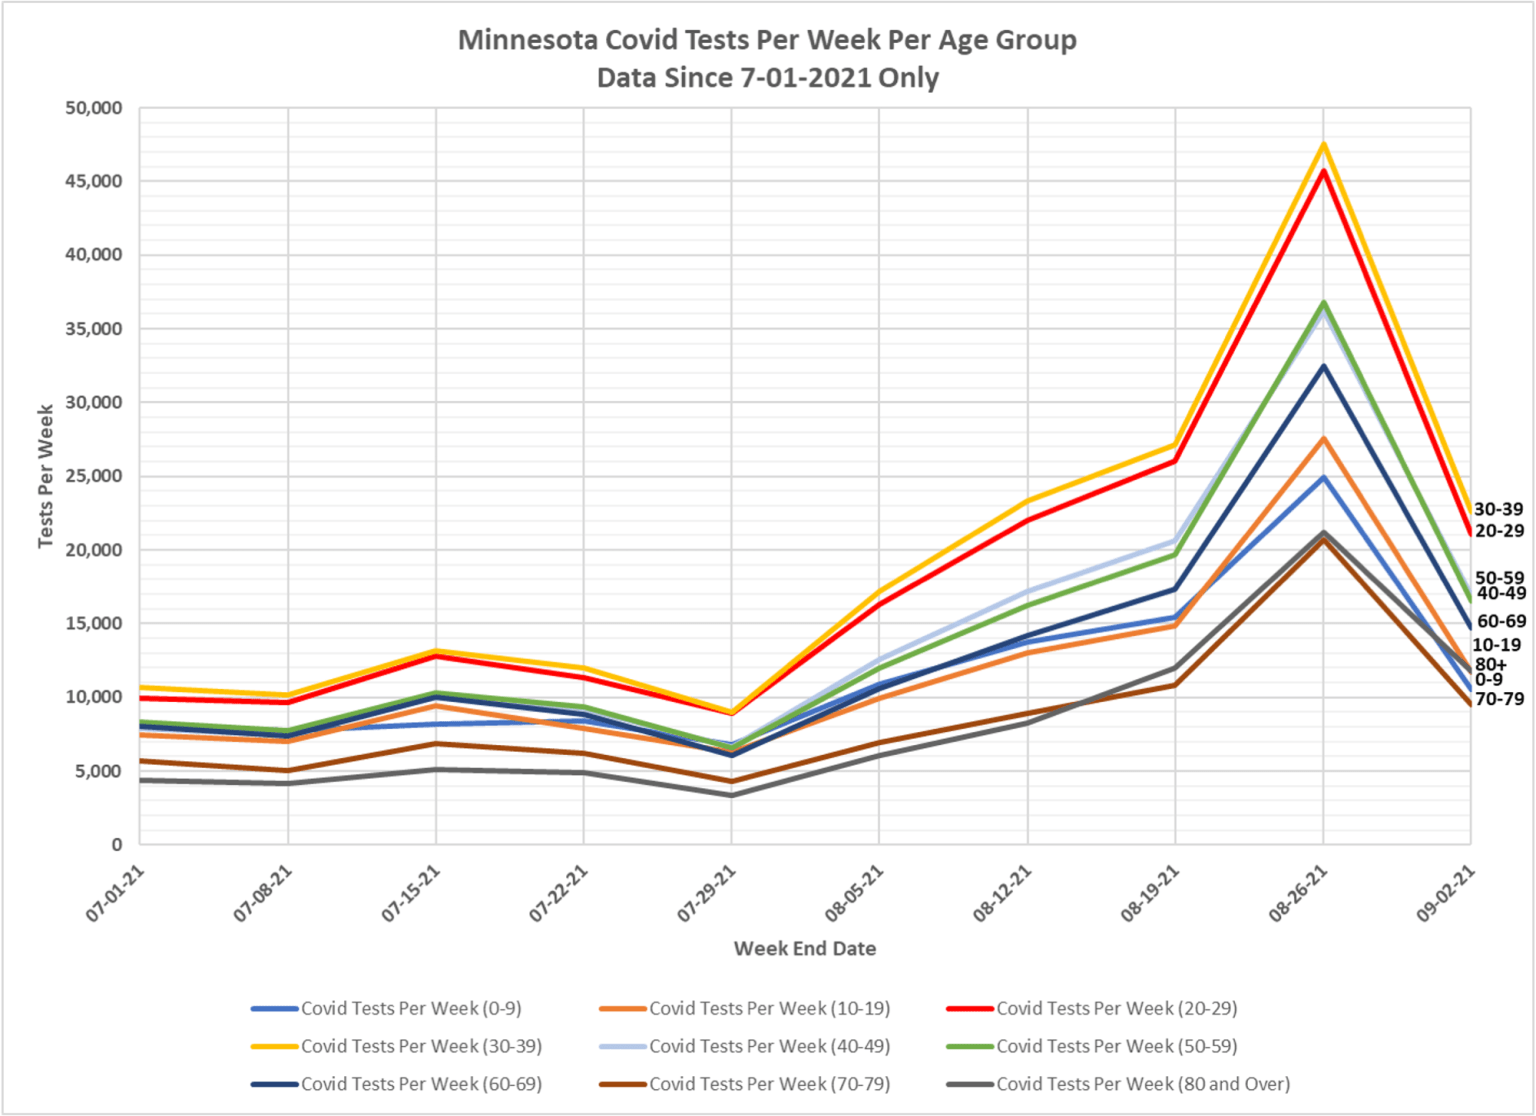
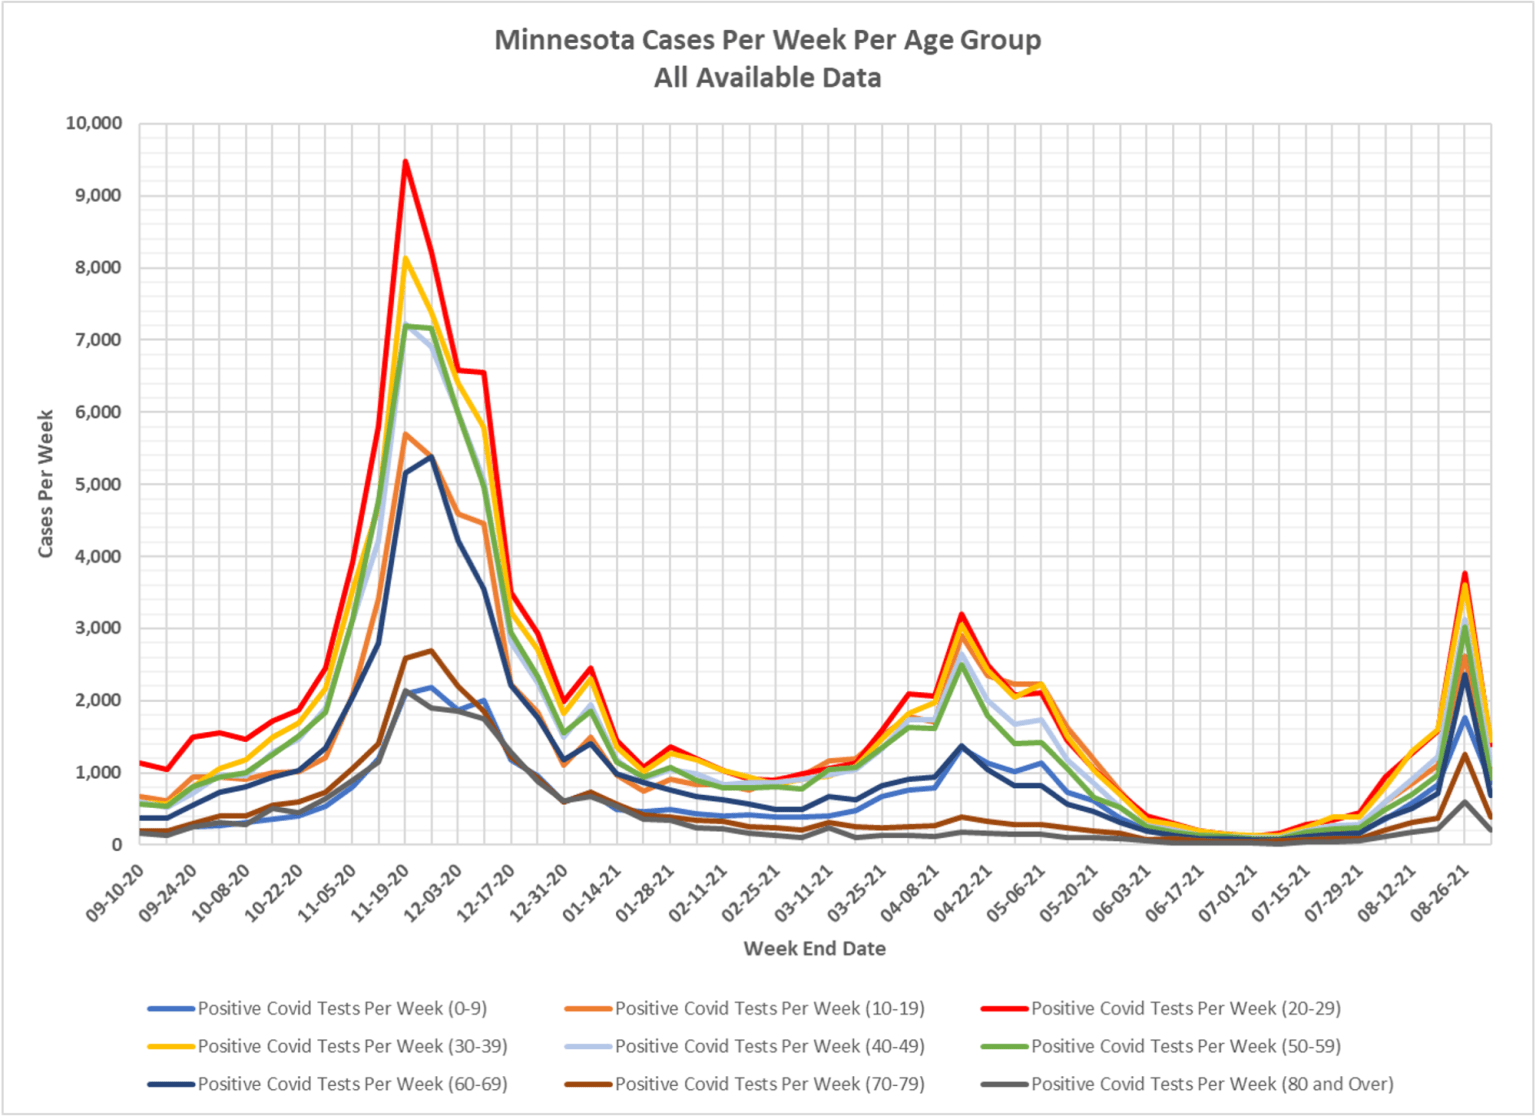
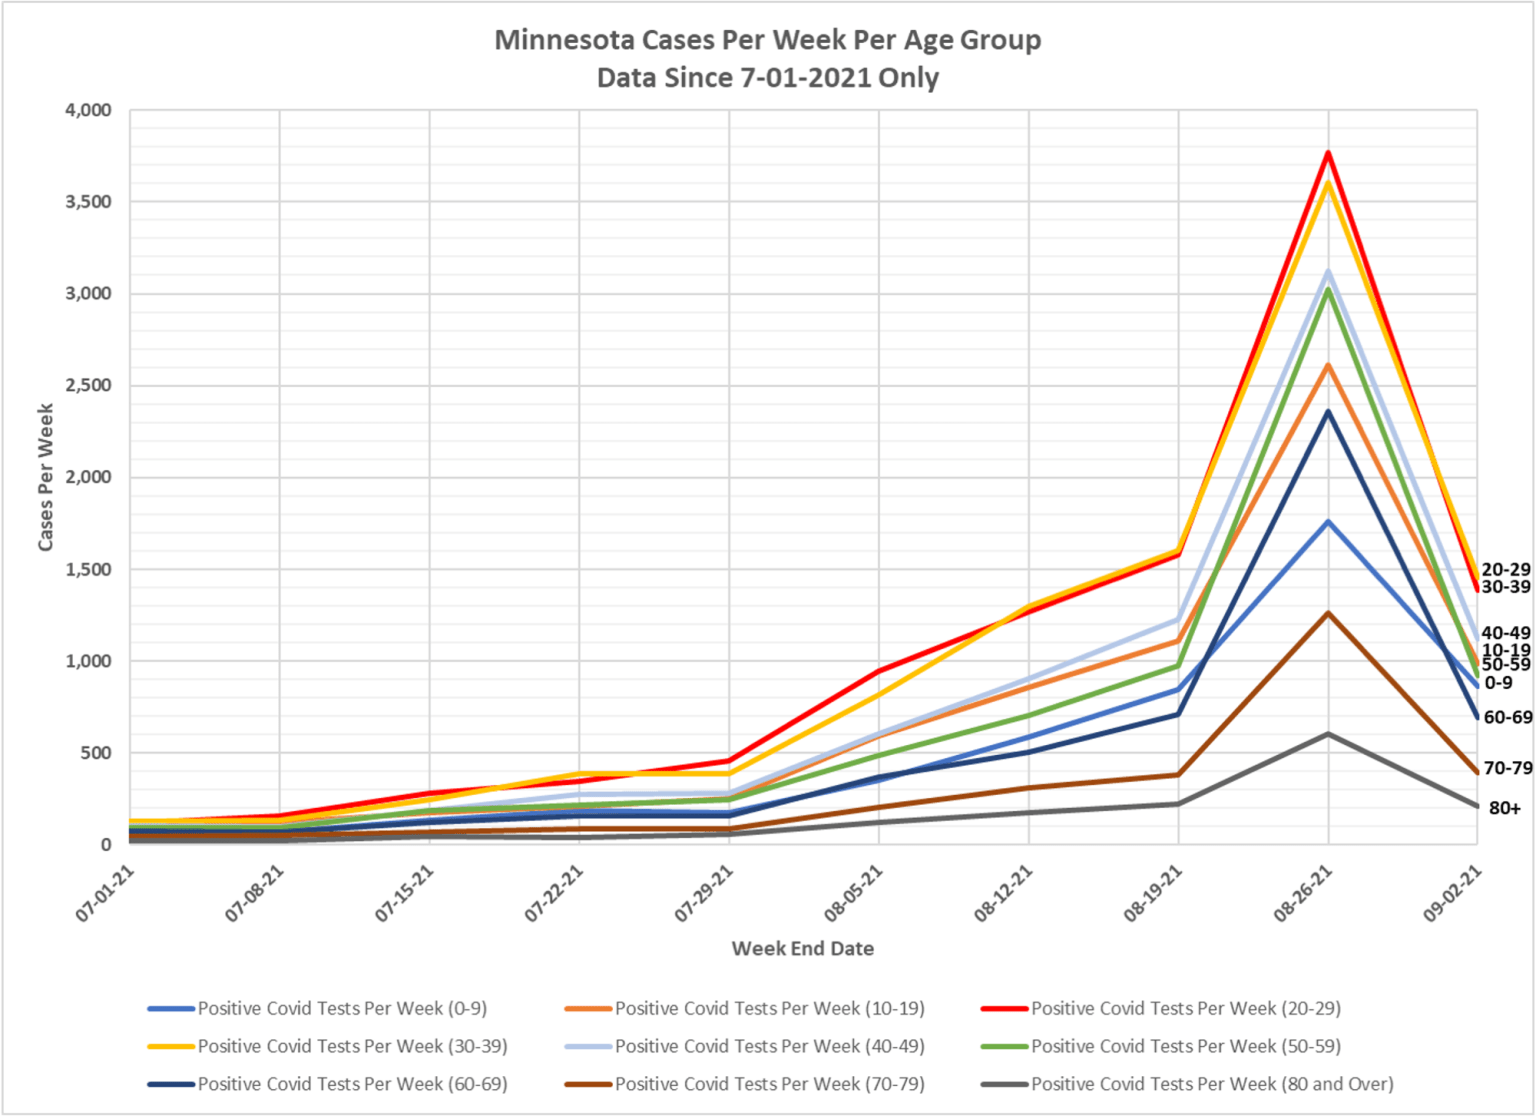
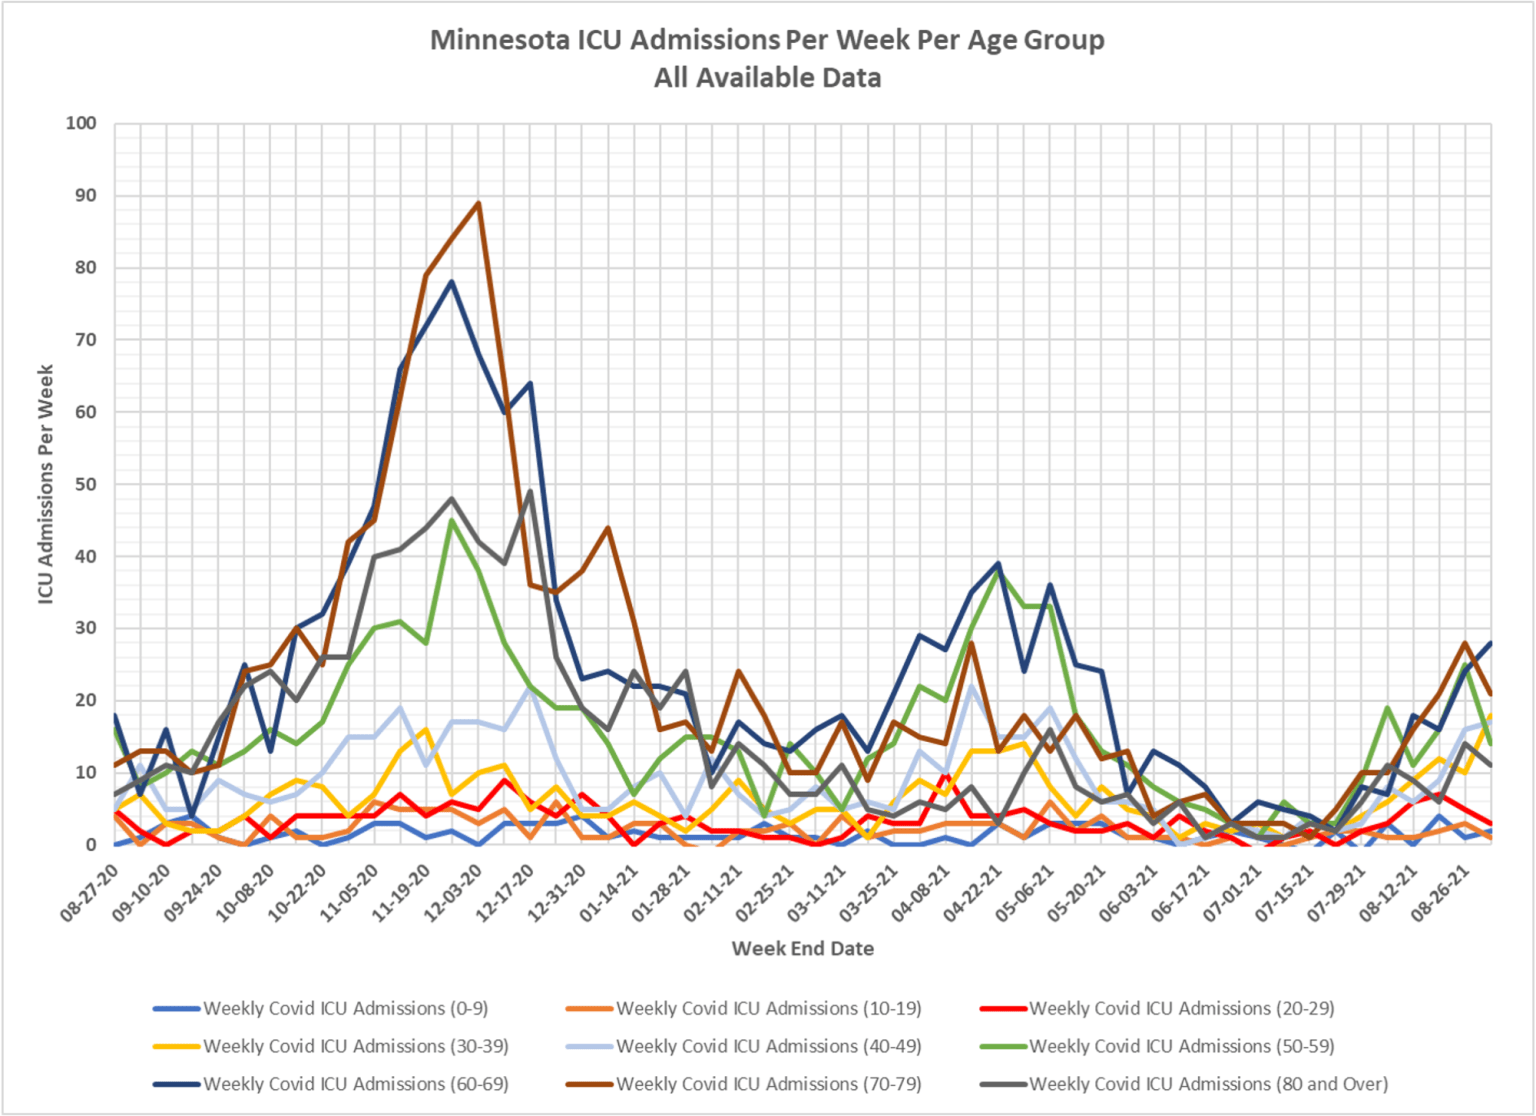
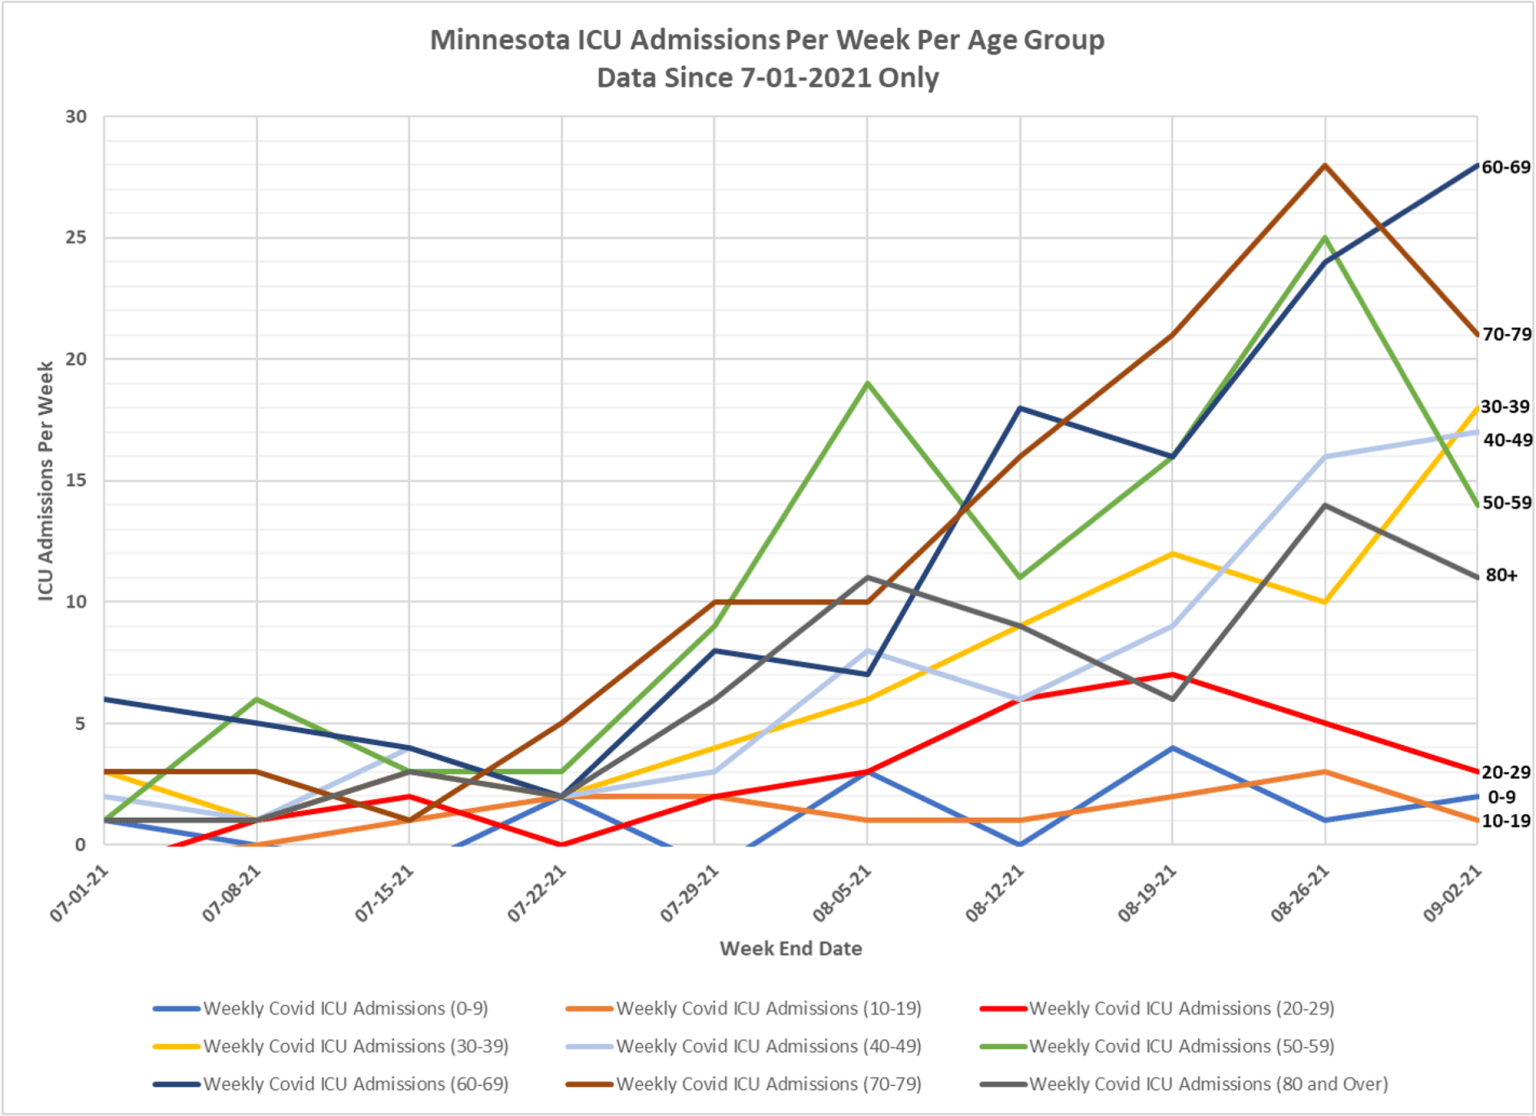
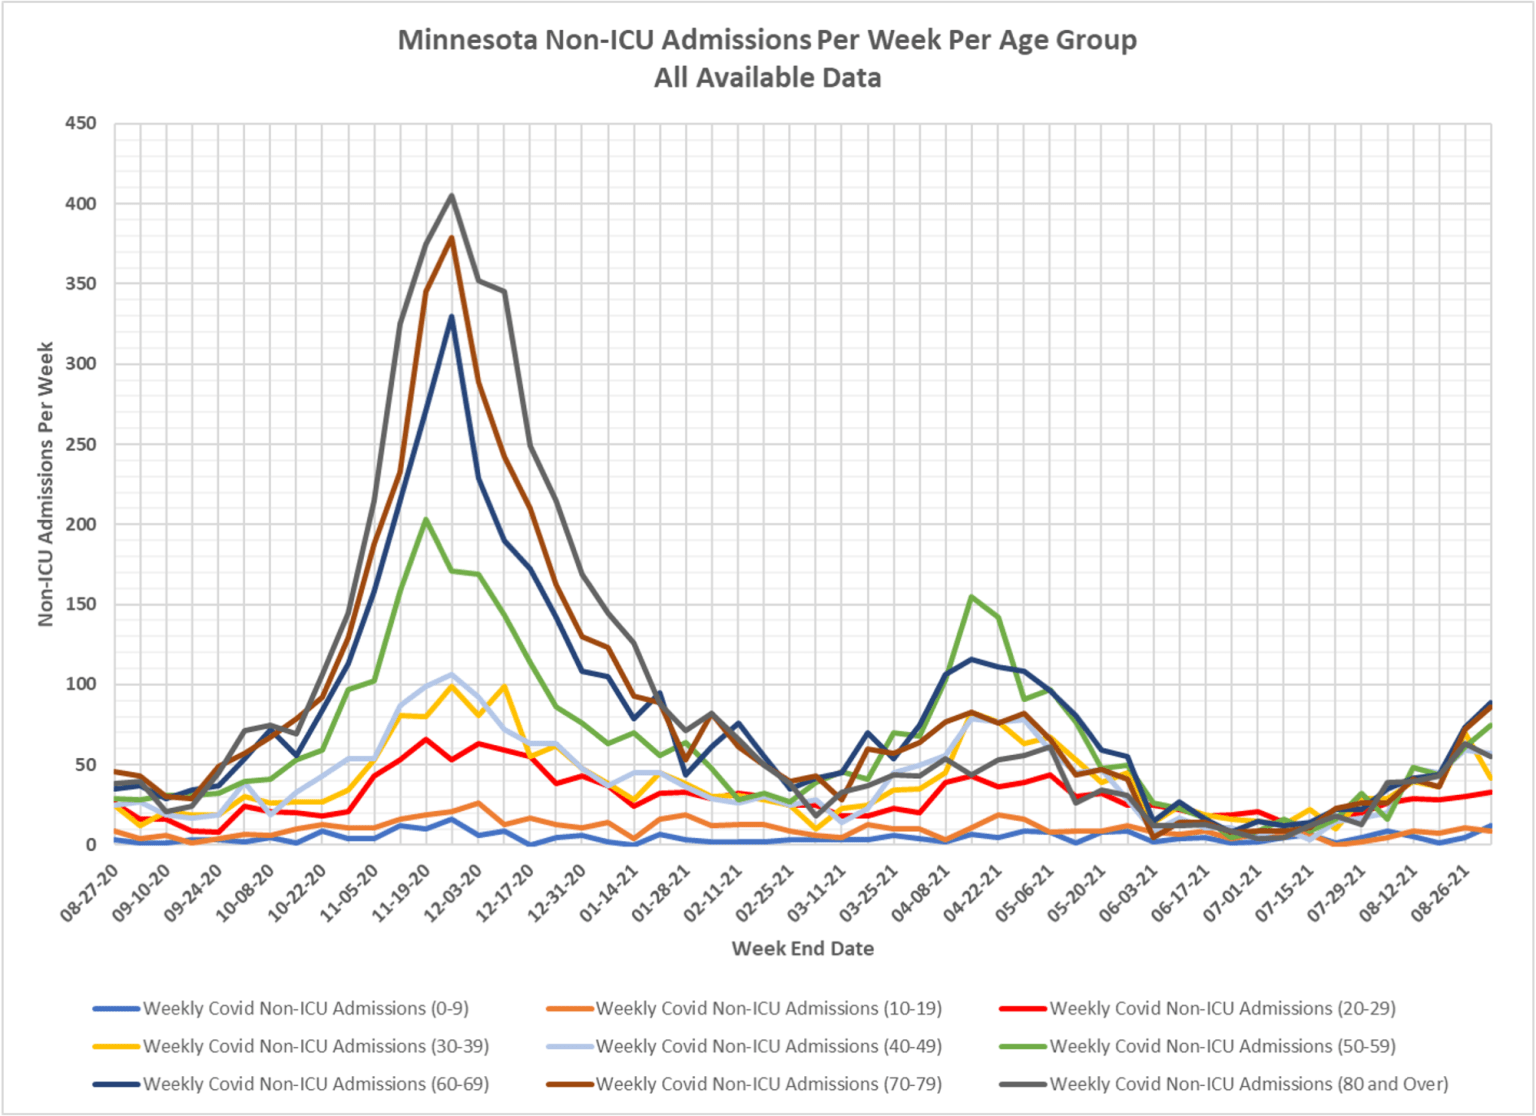
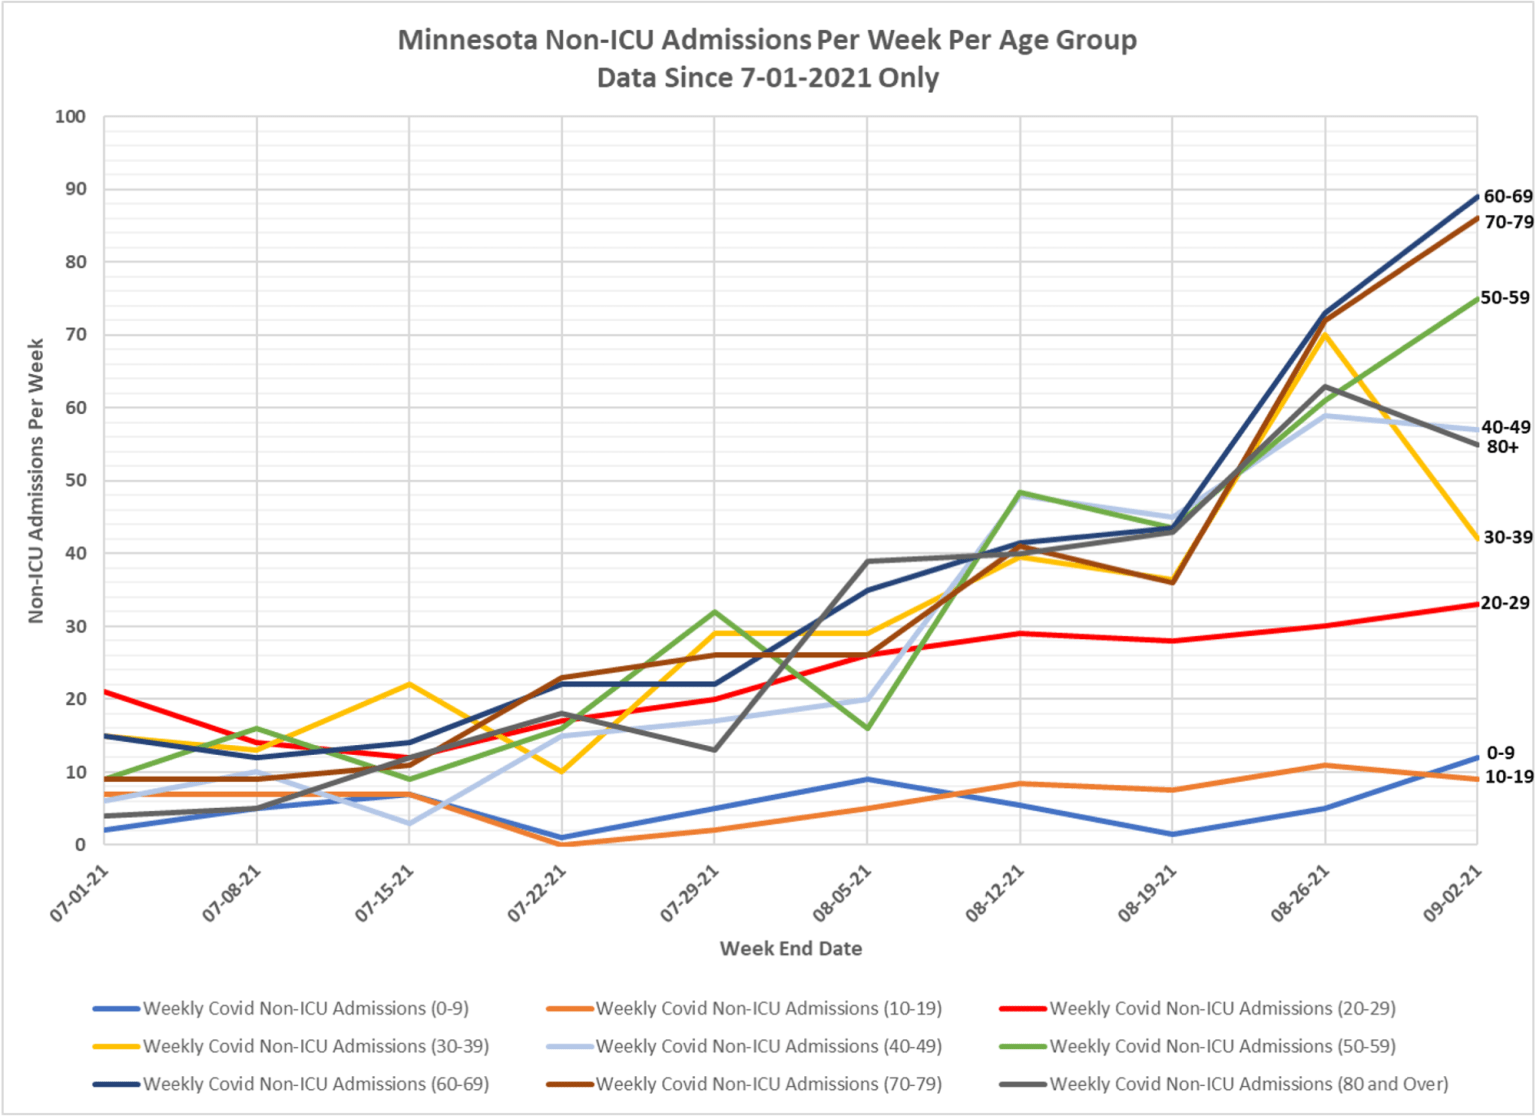
The MDH has published data that on September 3 was graphically plotted by a third party. I share some of those graphs with you, below. In general, the graphs show that among school-age children we are seeing a recent rise in Minnesota cases, but with low and relatively stable lines showing subtle weekly fluctuations in hospitalizations where COVID is a factor. These data can of course change, and we will be keeping a close eye on them.
Click on an individual graph to enlarge.
Of particular concern at PA, this year as last, is protection of those most vulnerable to serious illness from COVID. The availability of vaccines and the presence of natural antibodies among many of the vulnerable are mitigations unavailable most of last year, and so many do now have additional protections. Yet as an added precaution we postponed Grandparents’ Days to the spring. We also will encourage vulnerable friends and family members to use caution in attending events at close quarters. And we are suggesting KN95 masks to community members who seek additional personal mitigation from potential exposure.
In the event of significant illness among the vulnerable, it is encouraging to learn of treatments [https://www.health.state.mn.us/diseases/coronavirus/hcp/therapeutic.html] that may, in some cases, reduce more serious risks.

